In this article, we explain what DevTools are, what features they provide, and how they can be used to analyse web applications in practice.
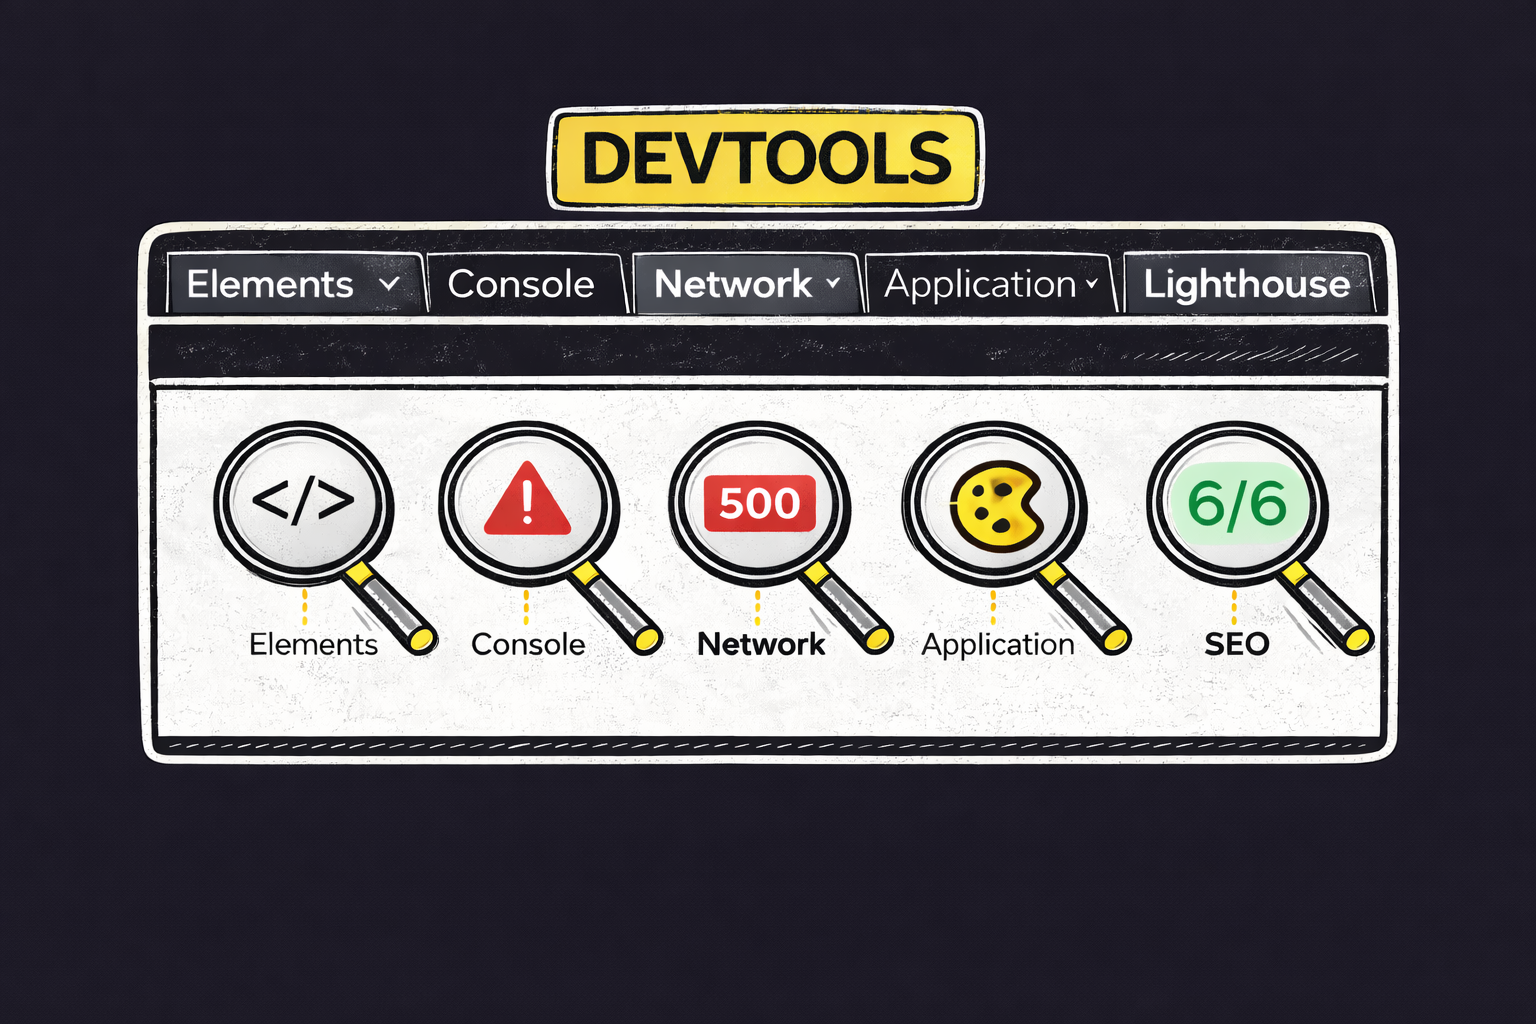
Developer tools are useful not only for QA engineers, but also for developers and product managers. Each specialist can use DevTools to find information relevant to their particular role.
DevTools allow you to look “under the hood” of a web application: examine the page structure, interface behaviour, network requests, errors, locally stored data, and the conditions under which the product operates on a user’s device.
Who Needs DevTools and Why?
DevTools are a universal tool for effective teamwork.
- QA engineers use DevTools to check layouts, analyse network requests, identify errors, inspect cookies and local storage, and reproduce bugs.
- Developers use them to debug application logic, analyse errors and interface behaviour, and quickly test changes.
- Product managers use DevTools to understand how a product loads, how it appears on different devices, and where performance or user-experience problems occur.
DevTools help everyone on the team speak the same language and identify the causes of problems more quickly.
DevTools are built into every modern browser, including Chrome, Edge, Firefox, and Safari, and do not require any additional installation.
You can open them by right-clicking on a page and selecting Inspect or Inspect Element, or by using one of the following keyboard shortcuts:
- F12
- Cmd + Option + I on macOS
- Ctrl + Shift + I on Windows
The DevTools interface consists of several tabs or panels. Below, we will look at the most important ones and explain how to use them.
Elements: Checking the Layout and User Interface
One of the main purposes of DevTools is to analyse the user interface and page layout. Developer tools allow you to:
- examine the structure of HTML elements;
- check element dimensions, spacing, and positioning;
- temporarily modify styles directly in the browser to test edge cases.
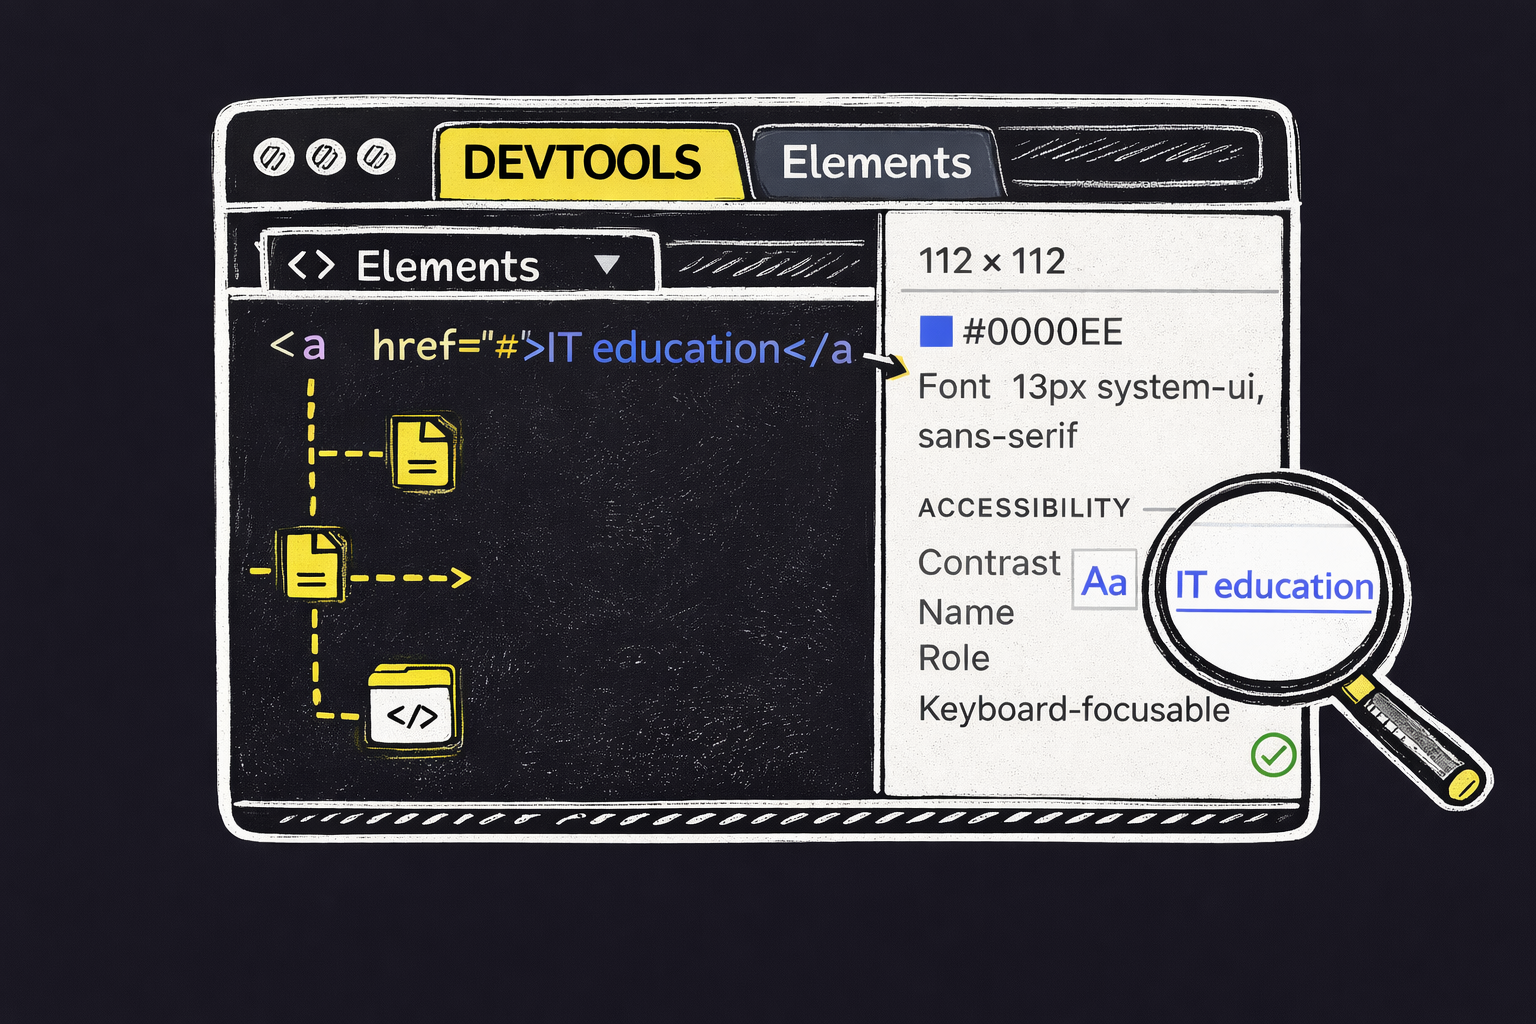
Elements: Fonts, Sizes, and Colours
DevTools allow you to inspect the visual properties of the interface in detail, including:
- the fonts being used;
- actual font sizes and line spacing;
- text and background colours;
- whether colour contrast meets accessibility requirements.
This is particularly important when testing layouts, comparing an interface with design mock-ups, and checking web accessibility.
Elements: Responsive Design and Screen Resolutions
DevTools can be used to emulate different devices and screen configurations, including:
- smartphones and tablets;
- different screen resolutions and pixel densities;
- portrait and landscape orientations.
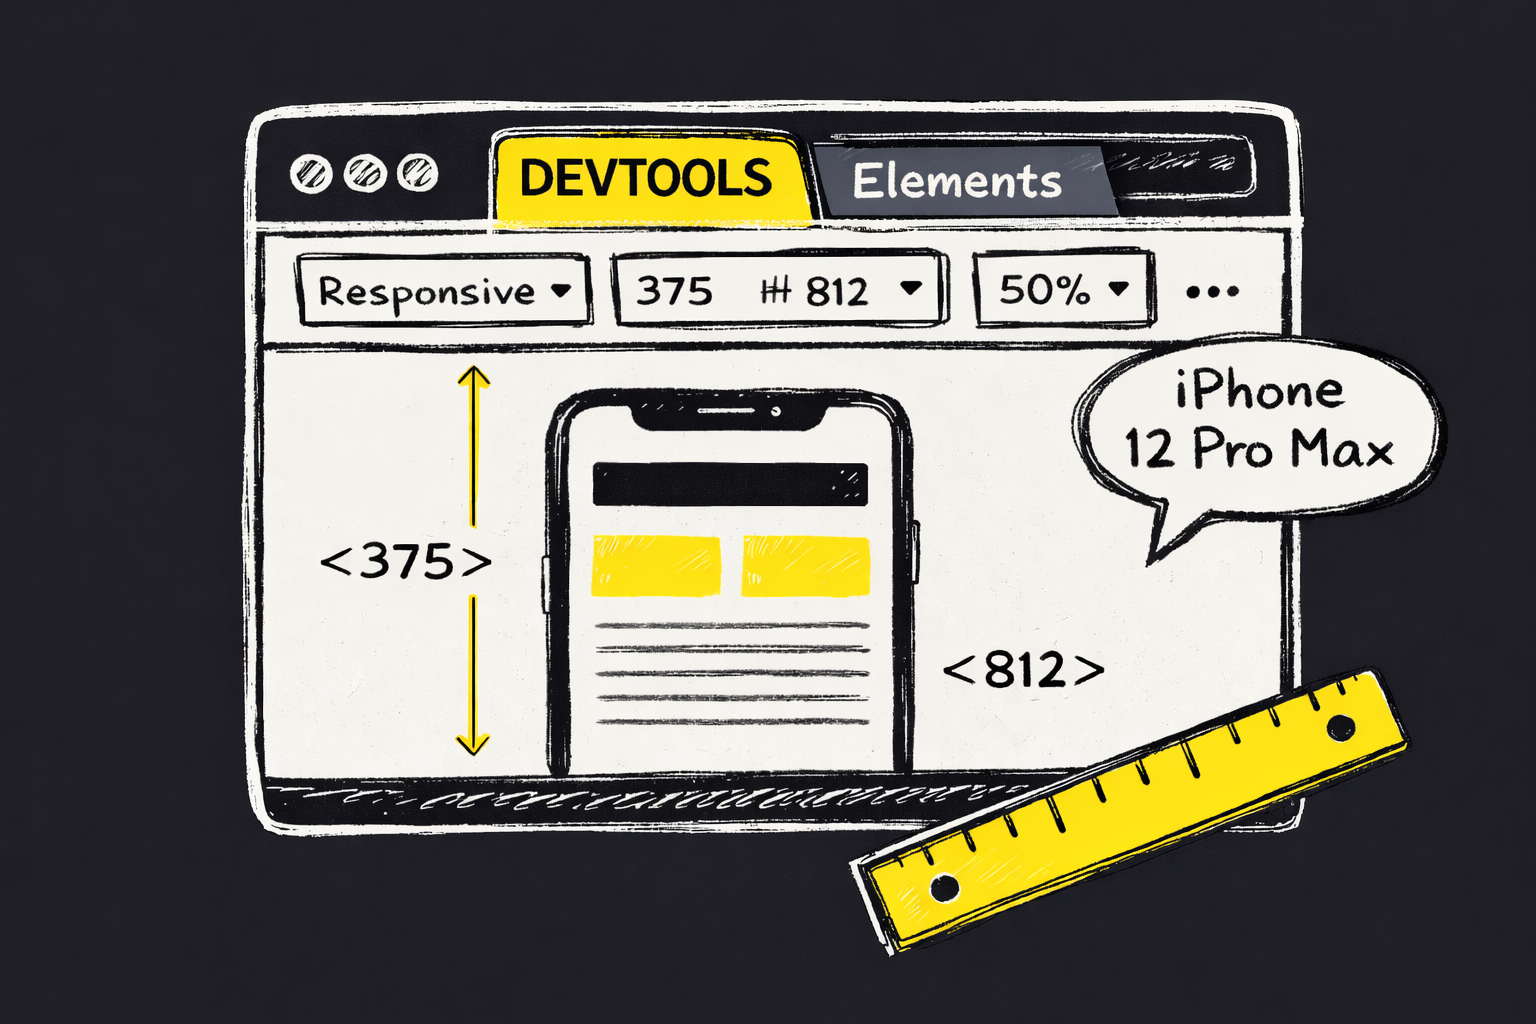
This allows you to check:
- whether the layout is responsive;
- whether elements are displayed correctly;
- whether menus and interactive components work properly;
- whether there is any horizontal scrolling or broken content.
Network: Analysing Network Requests
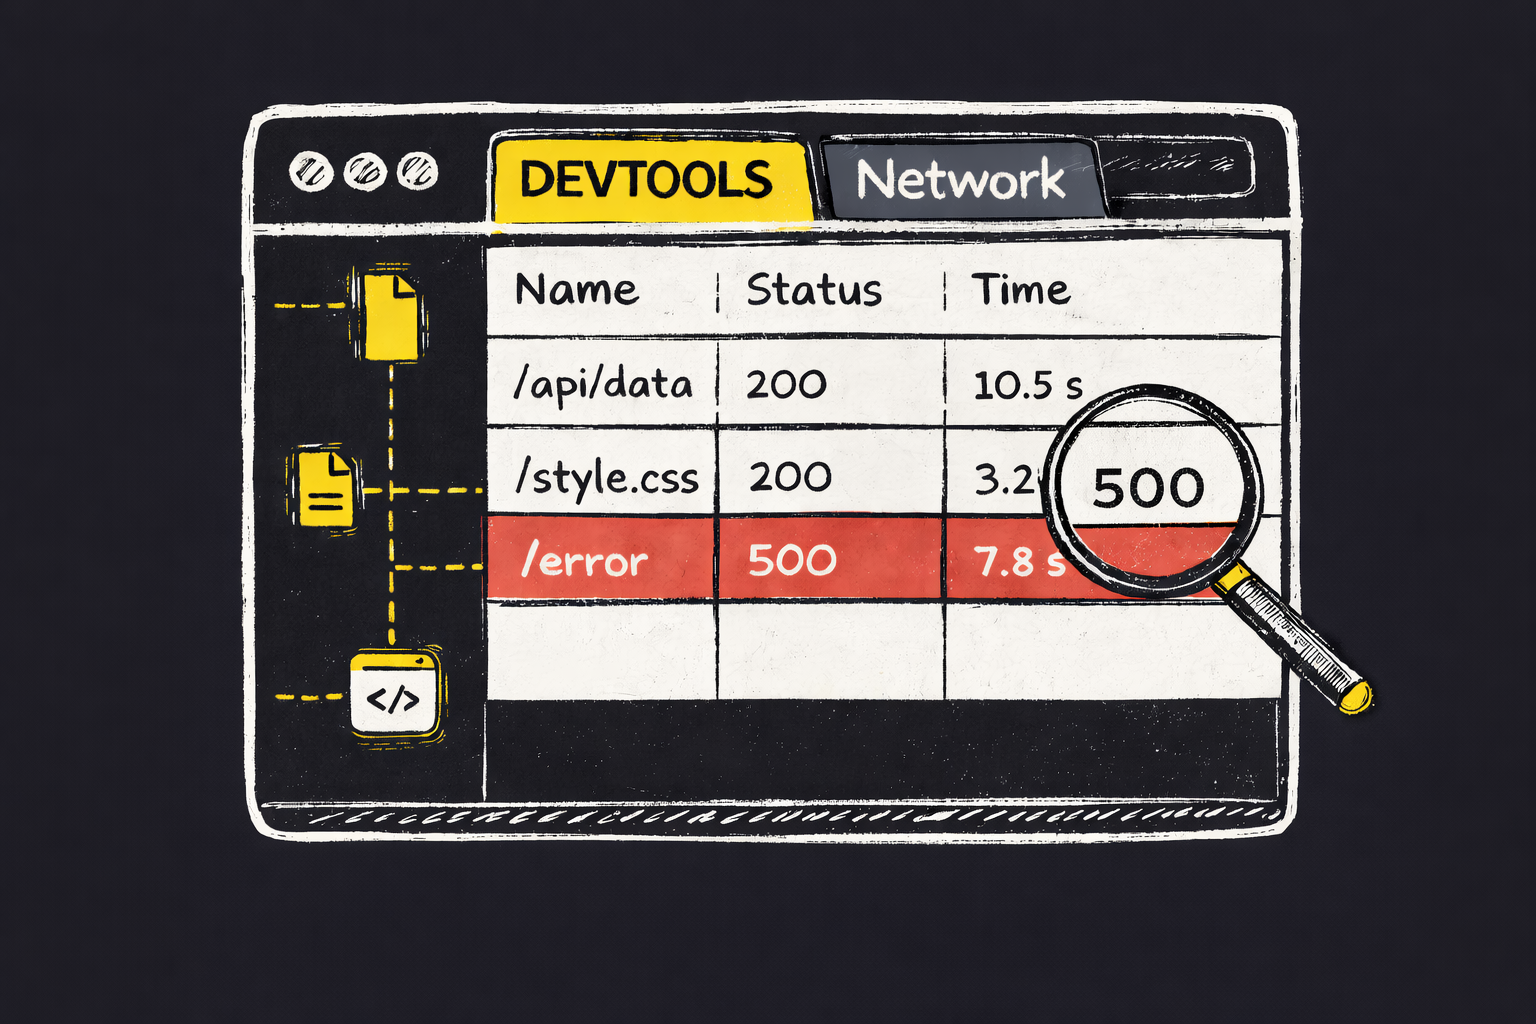
The Network tab displays all requests made by a web application, including:
- API requests;
- images, fonts, and stylesheets being loaded;
- response status codes and loading times.
DevTools also allow you to artificially reduce the network speed. This helps you:
- check how the application behaves with a slow internet connection;
- test loading indicators and placeholders;
- analyse the user experience under unstable network conditions;
- identify performance problems.
This information is important because it provides a complete understanding of how the application actually works “under the hood.”
It allows QA engineers, developers, and product managers to identify API errors and response codes, find resources that failed to load, assess page speed, quickly locate the source of a problem, and make informed decisions about how it should be fixed.
Cookies and Local Storage
DevTools provide access to the data stored locally by the browser:
- Cookies are often used for sessions, authentication, and user preferences.
- Local Storage and Session Storage are used to store tokens, flags, and application state.
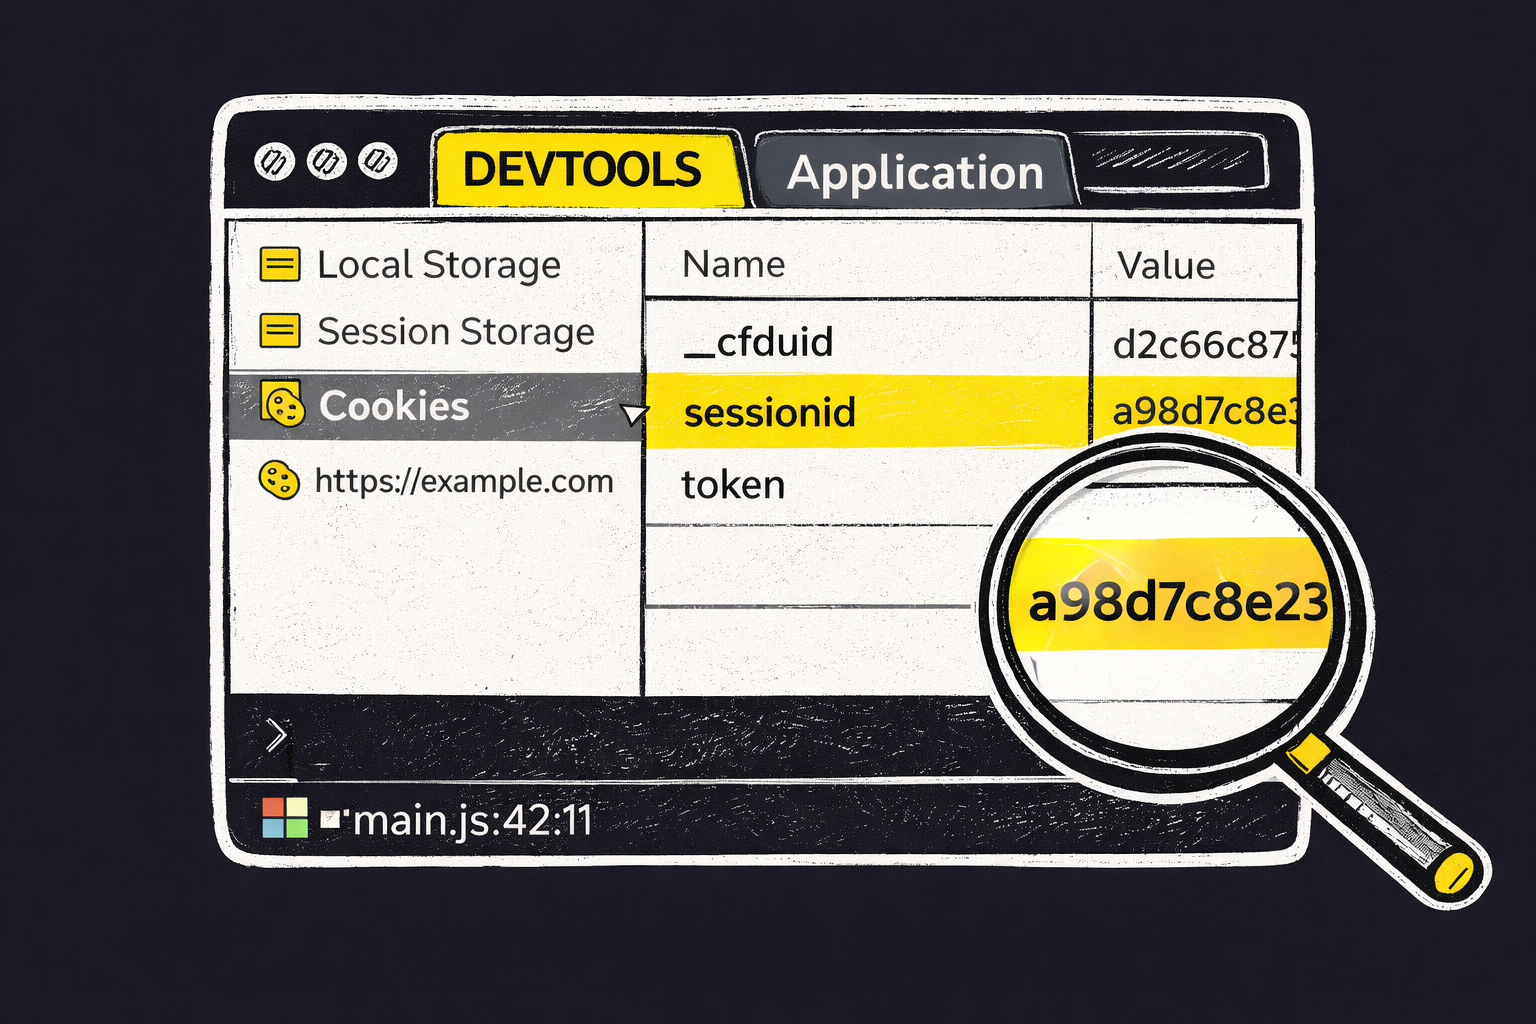
Using DevTools, you can:
{$te}
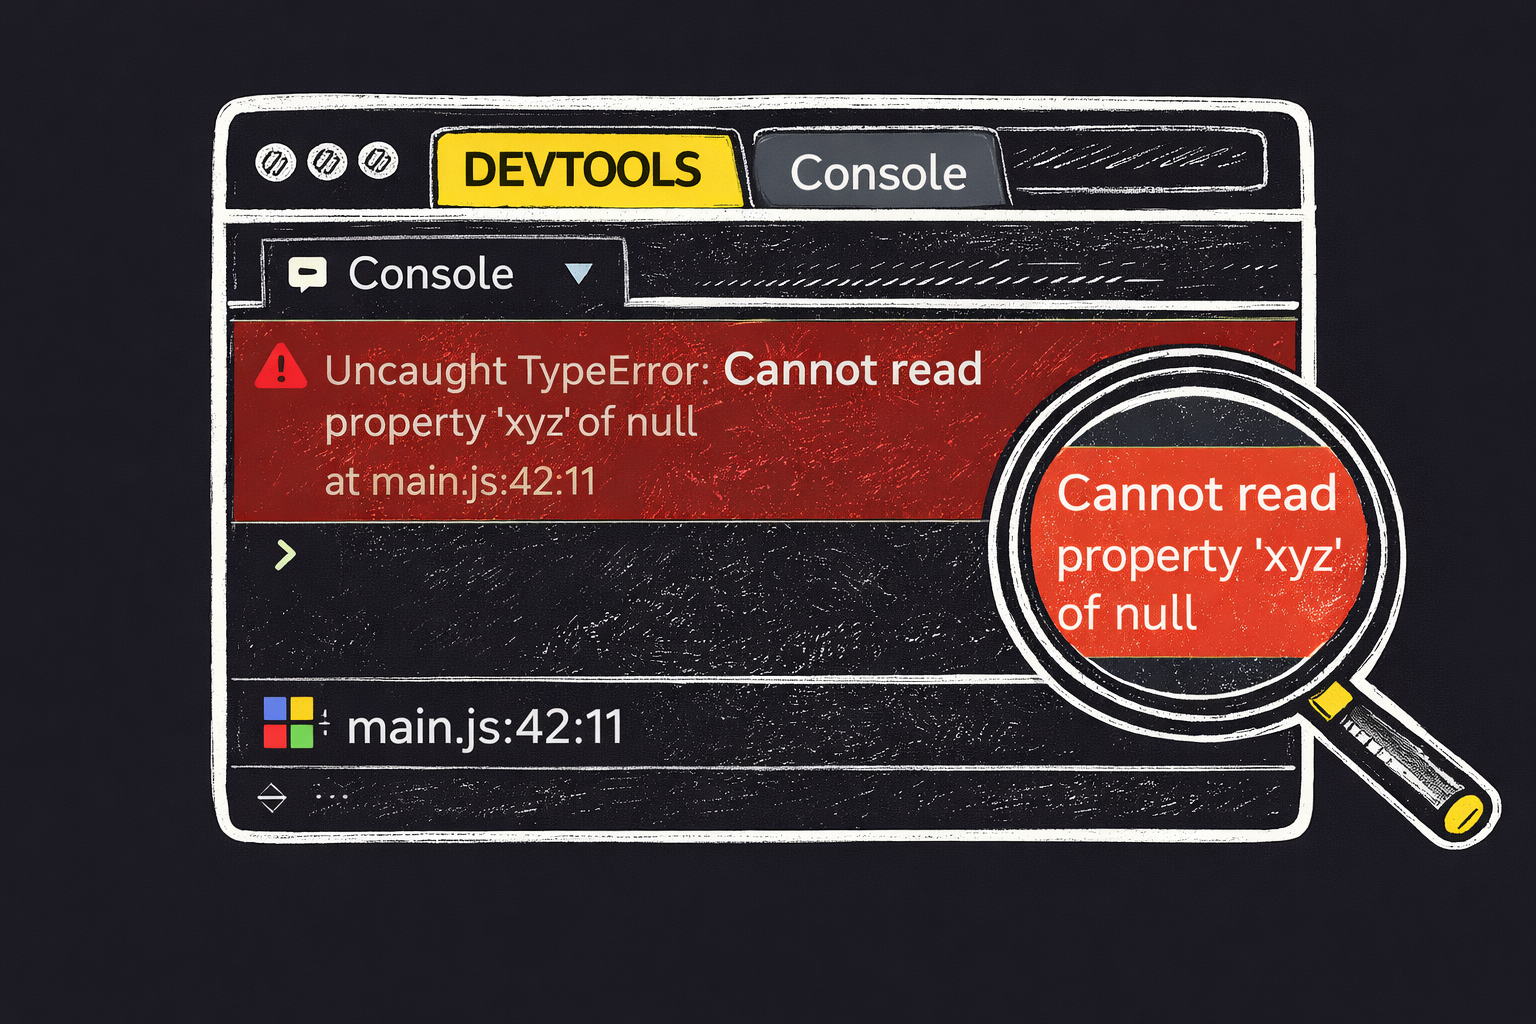
Console: Errors and Application Behaviour
The Console tab displays:
- JavaScript errors;
- warnings;
- messages about problems with resources such as fonts, images, and stylesheets.
Even when a user cannot see a problem visually, console errors may indicate real bugs or potential issues.
Lighthouse and Basic Accessibility Testing
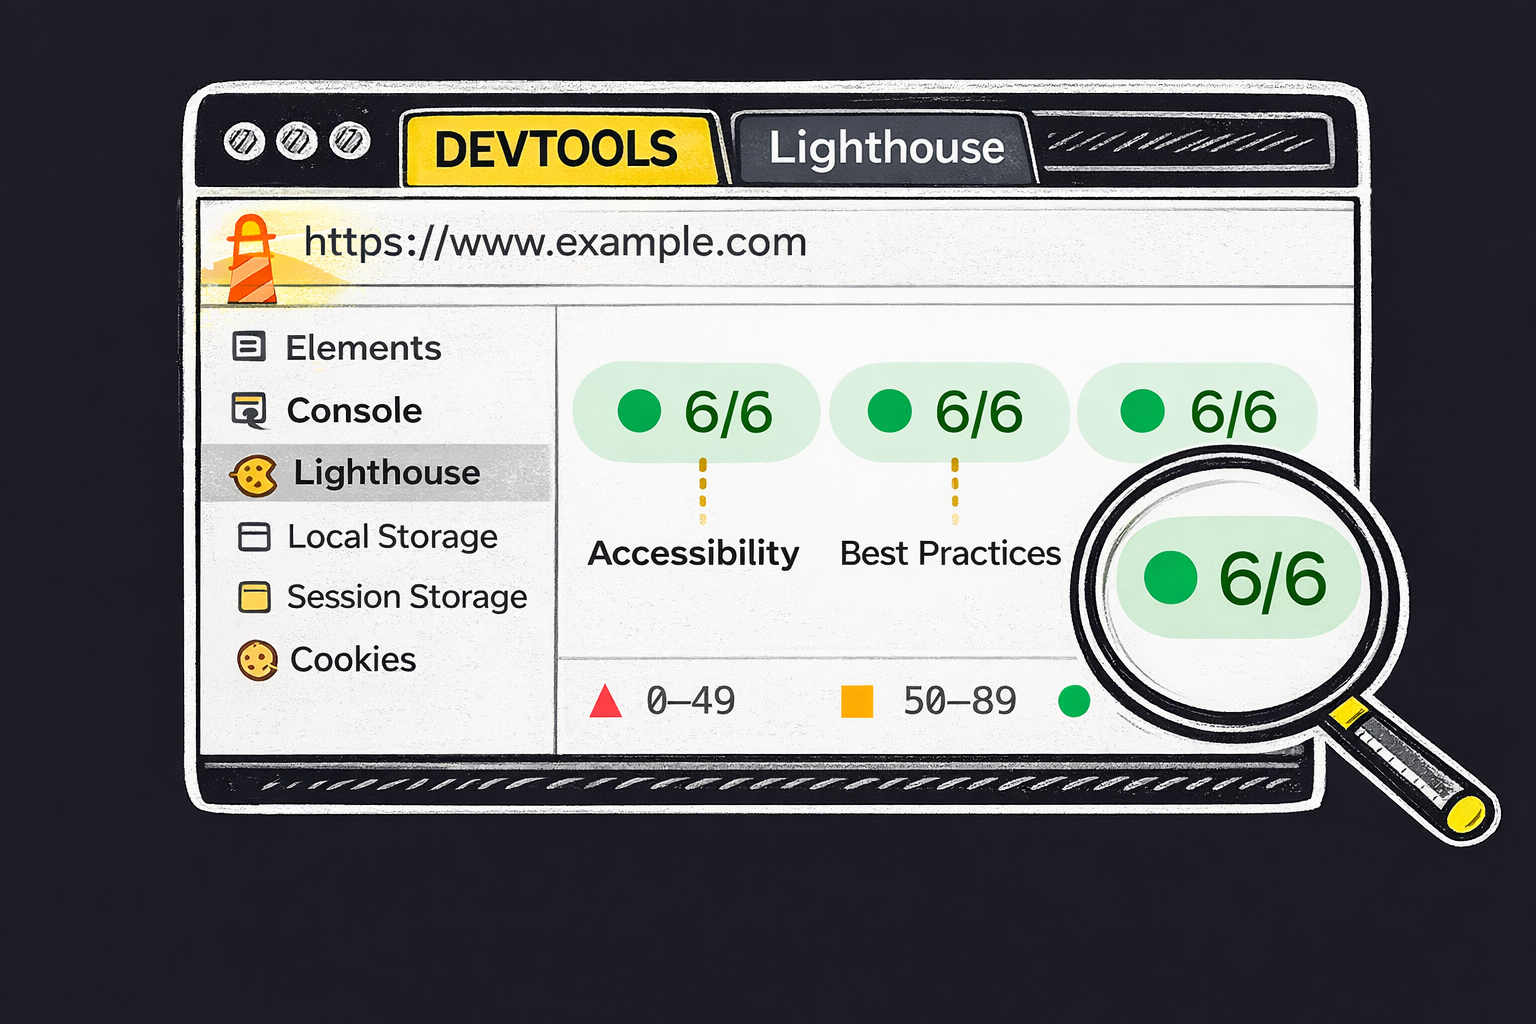
DevTools include Lighthouse, a tool that automatically analyses a web page according to various criteria.
Lighthouse can perform a basic accessibility, or a11y, check. It can:
- identify colour-contrast problems;
- check element semantics and verify that HTML tags are used for their intended purpose—for example, that an action button is implemented as a <button> rather than a <div>, and that the main page heading uses an <h1> rather than a styled <span>;
- provide recommendations for improving the quality of the interface.
For QA engineers, developers, and product managers, Lighthouse is a convenient way to quickly evaluate whether a product meets basic accessibility requirements.
Accessibility testing is important because accessibility is not merely a recommendation—it is a legal requirement.
Under the European Accessibility Act, or EAA, from 28 June 2025, digital products and services in the European Union—including websites, online services, e-commerce platforms, and banking and financial products—must comply with accessibility requirements.
Conclusion
DevTools are not simply a tool for developers. They are a universal environment for analysing web applications and can be used by the entire product team.
They help teams:
- find and reproduce errors more quickly;
- check layouts, responsiveness, and accessibility;
- analyse network requests and application performance;
- better understand how a product works for its users.
That is why working with DevTools is an important part of the education and training of QA engineers, developers, and professionals responsible for making product decisions.